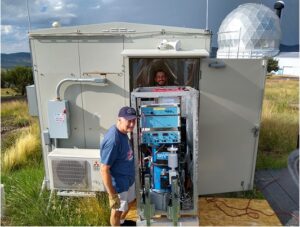
The team from the University of Texas at Austin’s Jackson School of Geosciences (Professor Clark Wilson, graduate student Chris Linick, and post-doc Jesse Hahm) has installed a superconducting gravimeter (SG) on McDonald Observatory’s Mt. Fowlkes as part of MGO’s development. The gravimeter complements MGO’s major instrumentation – a geodetic Very Long Baseline Interferometry station (VLBI) and a Space Geodesy Satellite Laser Ranging station (SGSLR) – by providing an independent way to monitor vertical motion of the site. In addition, the gravimeter is sensitive to tiny changes in subsurface water storage and will be used to study nearby ground water changes as part of an NGA-funded project (“Removing Sub-microGal Hydrologic Signals in Absolute Gravity Observations”).
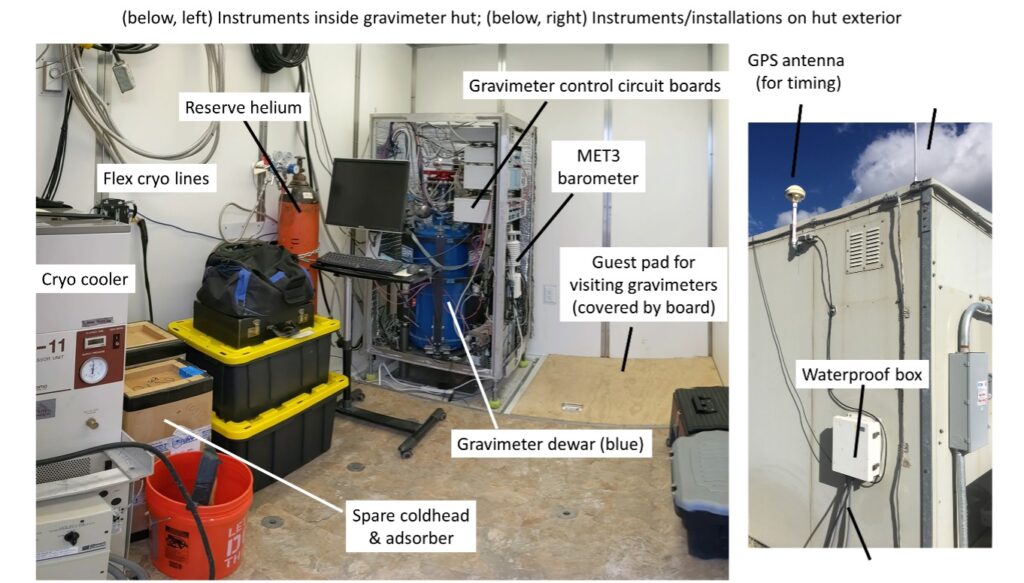
In combination with observations from other geodetic and hydrologic instruments, three related projects will:
- Contribute gravity-derived observations of vertical site motion to a larger NASA Space Geodesy initiative to improve the International Terrestrial Reference Frame,
- Enable a better understanding of local water storage dynamics at McDonald Observatory and in similar mountainous, desert terrains, and
- Characterize microGal and sub-microGal gravity variations due to water storage, atmosphere, and other sources as part of an NGA-funded project to improve absolute gravimeter surveys.
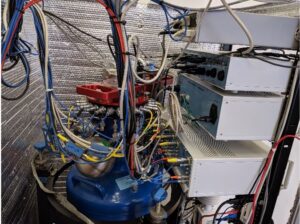
Superconducting gravimeters are classified as “relative gravimeters” rather the alternative ‘absolute gravimeters.” Relative gravimeters are able to constantly monitor gravity variations over long periods of time, as long as power is available and the superconductivity is maintained. There can be some small drifts, which are sometimes removed in the analysis or by comparisons with an absolute gravimeter (AG) that can be co-located at the site.
Improving Absolute Gravimeter Surveys
As a third project involving SG047 data, the National Geospatial Intelligence Agency is funding a study on:
- Reducing differences between successive AG occupations typically separated by months/years, and
- Reducing common, small-scale (sub-microGal) perturbations during multi-day AG campaigns.
We are studying methods for achieving these reductions using continuous data from the SG, knowledge of the local hydrologic cycle, and episodic gravity data from repeat Absolute Gravity surveys (the first of which NGA conducted in Dec 2018).
The first stretch of usable SG047 data spanned 30 days – from November 3, 2019, to December 2, 2019. As set forth in the chart below, raw gravity voltages recorded at 1 Hz were filtered to 1-minute (blue) and show a pronounced solid Earth tide signal. We convert voltage to acceleration (1 microGal = 10-8 m/s2) via a scaling factor of -88.9 microgal/V. The Earth tide variations (dominated by diurnal and semi-diurnal tides) in the gravity data (red curves) are the largest signal, and represent fluctuations in gravity of about 1 part in 10 million of the acceleration of gravity (about 9.8 m/s2). The SG is able to sense changes 1,000 times smaller than this; but Earth tides represent the largest signal in the raw data. Consequently, the tidal signals must be modeled and removed from the data to form a non-tidal gravity residual (red). The primarily diurnal fluctuations of 2-5 microGals in this residual have many potential sources, including atmospheric pressure variations and ocean load tides.

Importance of SG Data
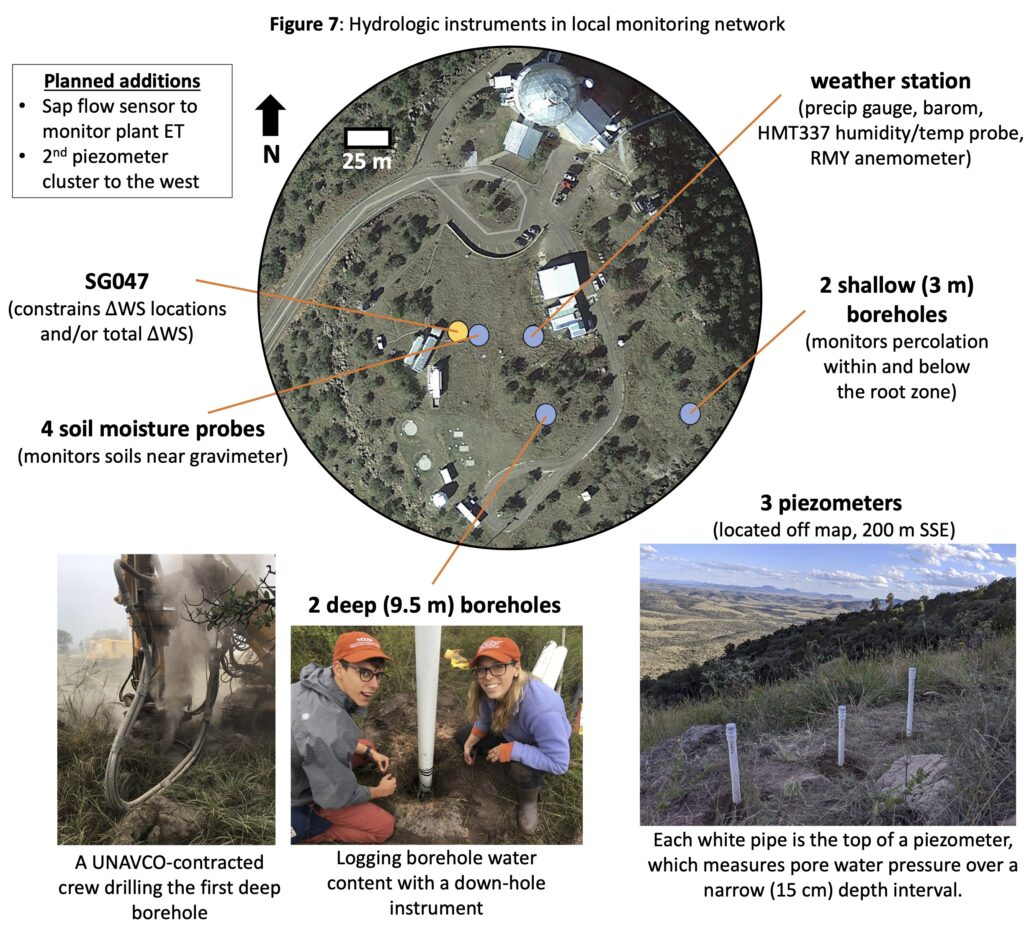
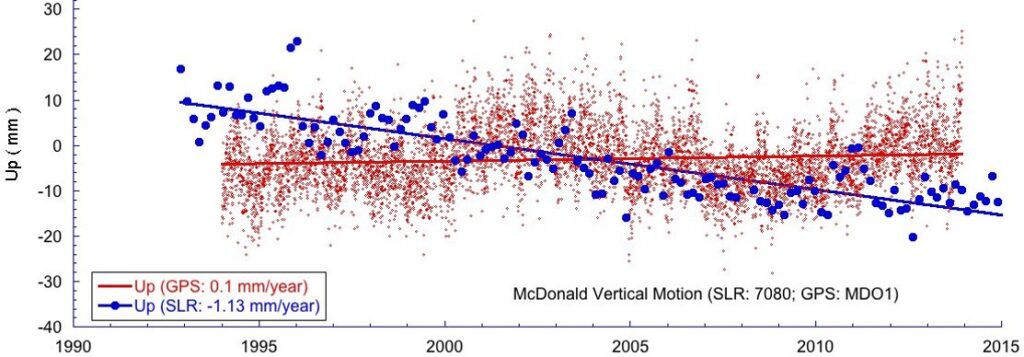
Precise observations of vertical surface motion (Δz) have been ongoing at McDonald Observatory for ~50 years – SLR observations since the 1970s, and continuous GPS tracking since 1992. Notably these two techniques show different long-term trends (see figure below). Since these techniques – together with VLBI and DORIS – are key to constructing terrestrial reference frames, this discrepancy is an active NASA Space Geodesy Project research topic. SG047 is contributing an independent Δ? observation for exploring this discrepancy further. Transforming SG data into Δ? requires accounting for attraction of water and air loads, requiring additional instruments to measure air pressure and soil moisture.
Contact Information:
Clark Wilson (crwilson@jsg.utexas.edu)
Chris Linick (clinick@utexas.edu)
